Connected data still feels hard to use
Teams can connect a database, spreadsheet, or API, but that does not automatically make the data understandable to the people who need answers.
AI-assisted query builder for connected data
QueryCanvas helps teams connect databases, spreadsheets, files, and APIs, ask questions in plain language, inspect the generated query, and turn answers into dashboards and reports.
Built for launch-ready reporting workflows
QueryCanvas is designed to help teams move from connected data to a usable answer faster, without turning the homepage into a heavy product demo.
Why teams get stuck
The pain usually starts after the connection is live: business users still need help understanding the schema, writing the query, and translating raw output into a decision.
Teams can connect a database, spreadsheet, or API, but that does not automatically make the data understandable to the people who need answers.
Non-technical teammates often depend on analysts or engineers for every new filter, join, and report request, even when the data is already available.
Without schema guidance, query assistance, and readable output, teams waste time translating structure instead of making decisions.
How QueryCanvas helps
QueryCanvas is built for the messy middle between raw data access and a polished reporting workflow: enough control for technical teams, with far less friction for everyone else.
Bring together PostgreSQL, MySQL, SQL Server, MongoDB, Google Sheets, REST APIs, Airtable, Notion, and uploaded files in one reporting workspace.
Let QueryCanvas help draft the query, show the structure behind the answer, and reduce the amount of hand-written SQL needed for everyday work.
Move from a question to widget-based dashboards, saved answers, share links, and scheduled reports without bouncing between separate tools.
Supported integrations
QueryCanvas is built to work across databases, spreadsheets, APIs, and uploaded files so teams can keep one reporting workflow even when the source systems differ.
Need a deeper setup path? The cards below are generated from the active source catalog, so this section stays in sync as new integrations go live.

Database
Explore MongoDB collections, generate query logic faster, and turn results into live dashboards.

Database
Query PostgreSQL data with AI assistance or a visual builder, then turn results into reusable reporting assets.

Database
Give teams a faster path to MySQL answers without making every request a manual SQL task.

Database
Support operational reporting on SQL Server and Azure SQL with a more approachable query workflow.

API
Query API-backed business data with structured setup, reusable connections, and clearer output.

File
Upload files and treat them like a source you can query, reuse, and combine with the rest of your data stack.
What makes it useful
The product value is not just faster querying. It is the ability to go from connected data to a readable, shareable result with less back-and-forth across the team.
Start from the systems you already have instead of exporting everything into a separate workflow first.
Describe the outcome you need, review the generated query, and move faster when the request would normally require SQL.
Turn query output into dashboard widgets so teams can combine multiple answers in one place instead of recreating the same reporting view over and over.
Publish dashboards for teammates, clients, or leadership with optional password protection and expiry dates when the audience should be controlled.
See results in a form business users can actually work with, then save and reuse the output as needed.
QueryCanvas is designed around connected sources and direct query workflows, not around copying your whole dataset into a separate analytics stack.
Product walkthrough
The old rotating slider added weight without explaining the product well. This walkthrough keeps the story linear: connect data, inspect context, ask a question, and turn the result into something the team can reuse.
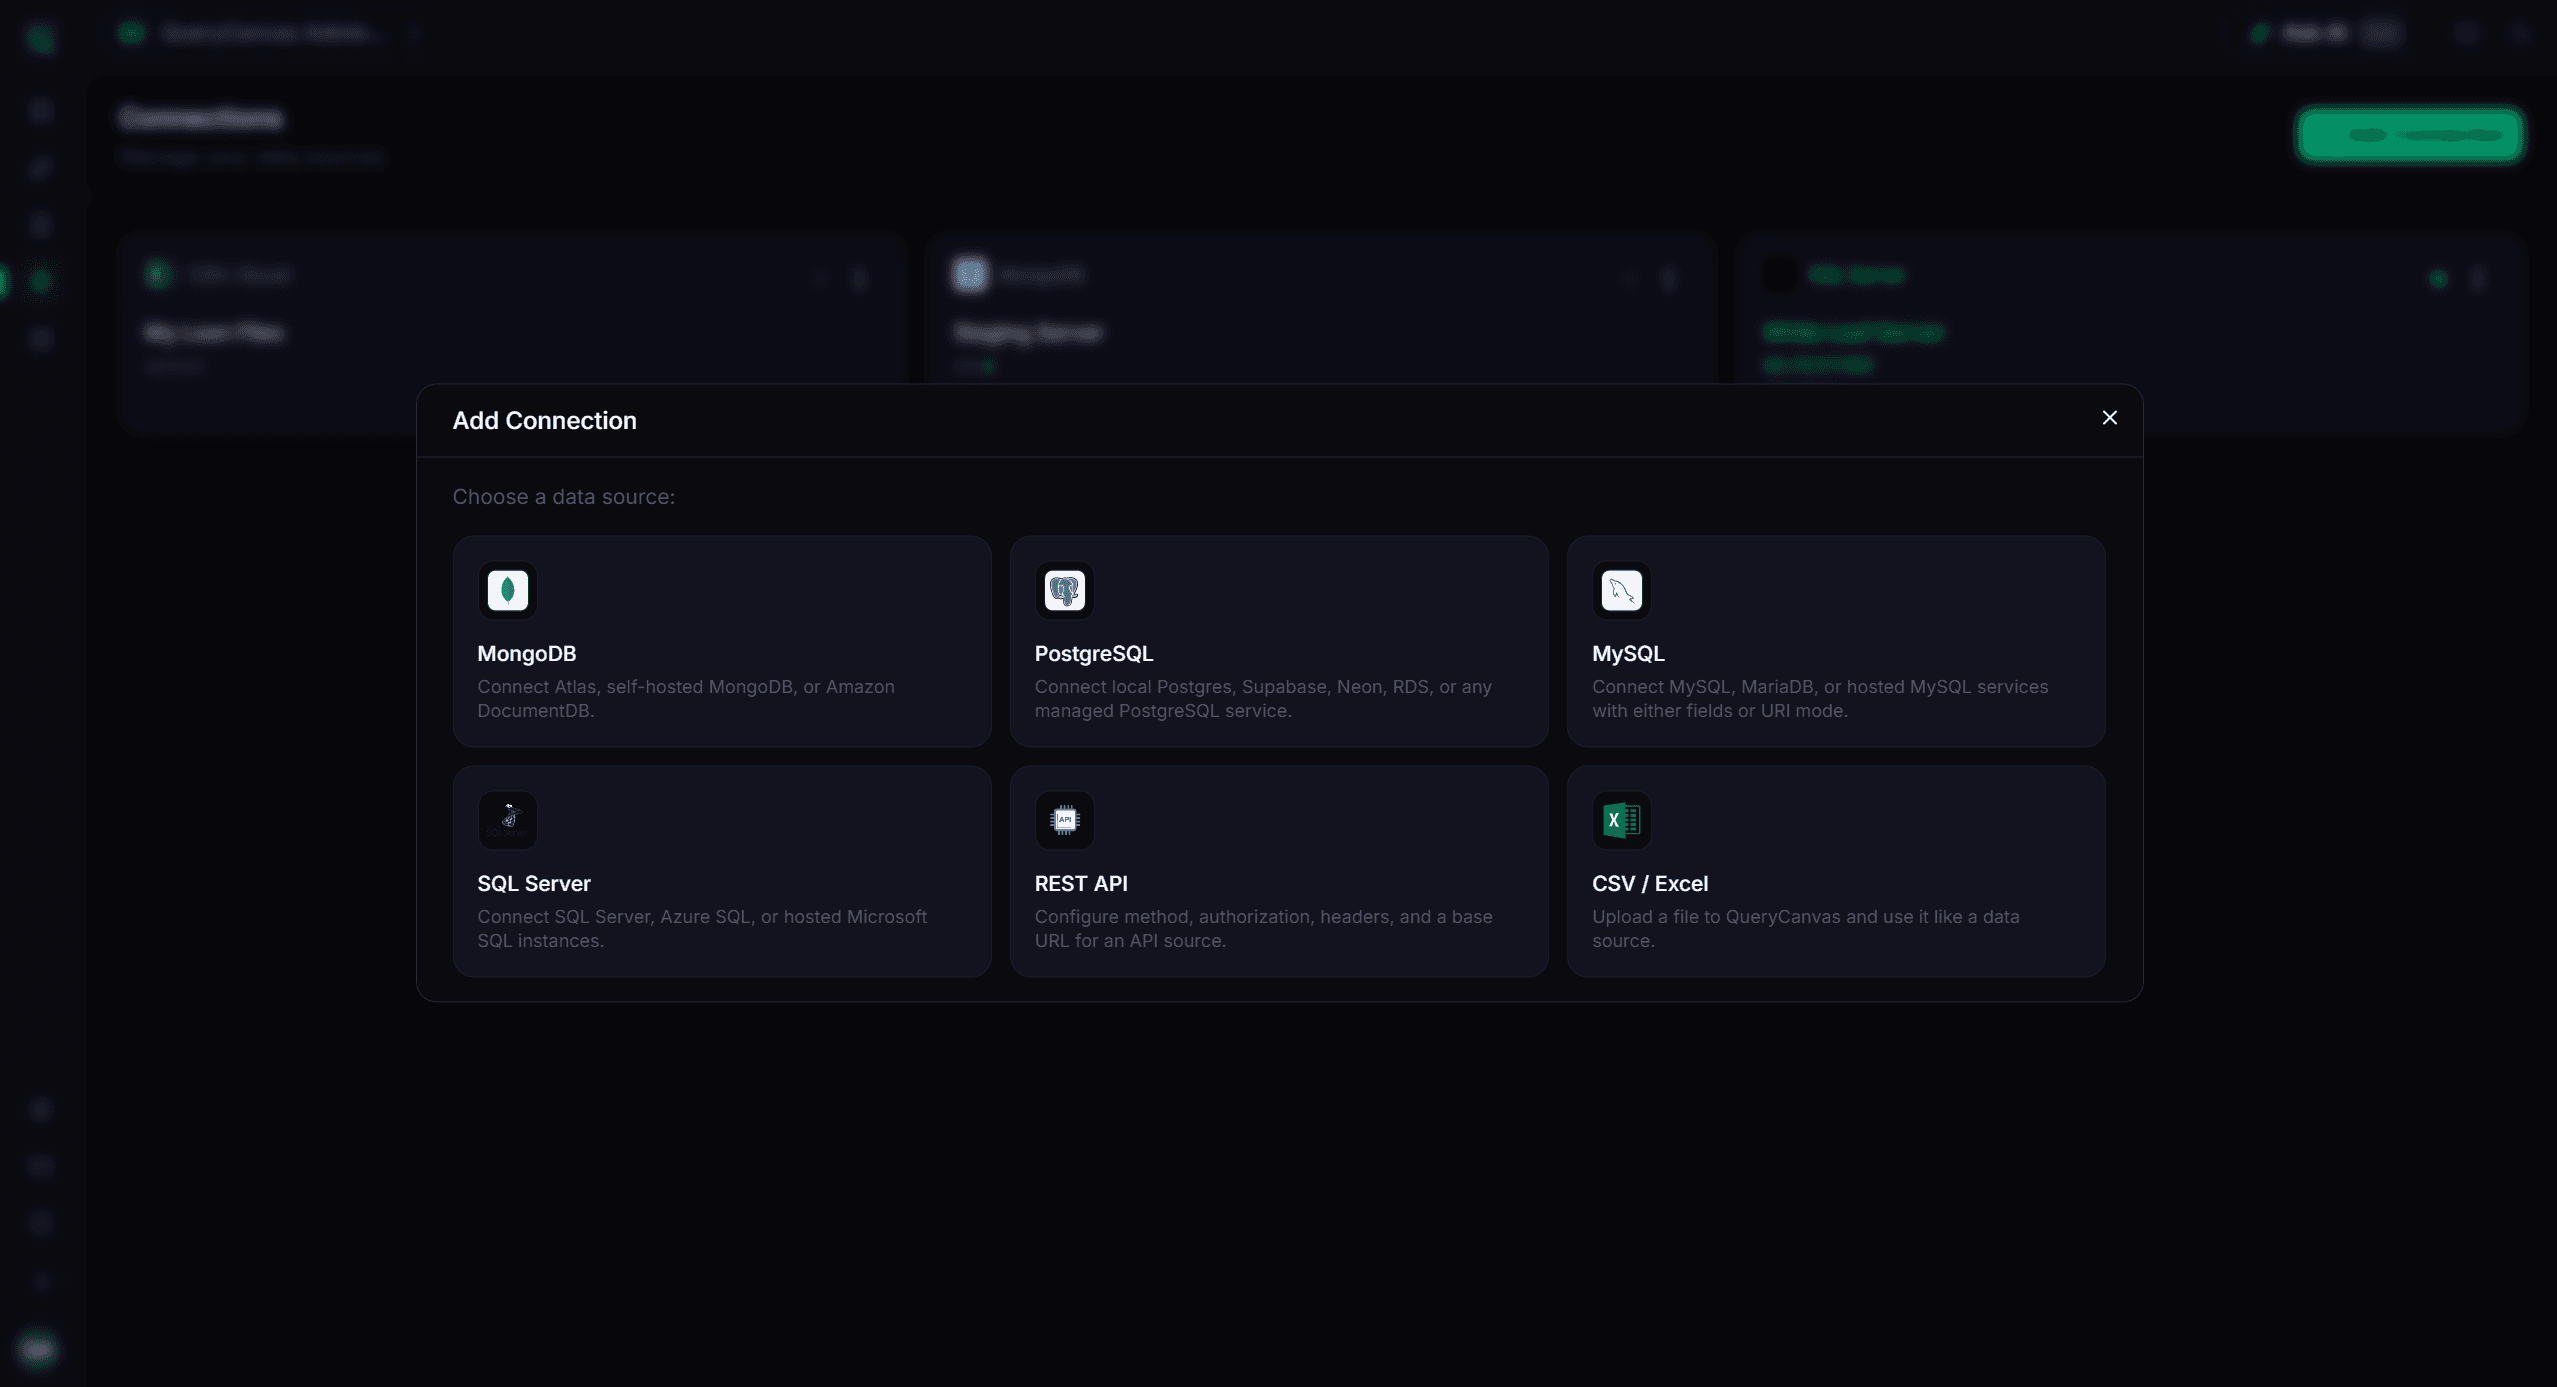
Step 01
Set up the data source, confirm access, and give your workspace a shared starting point for reporting.
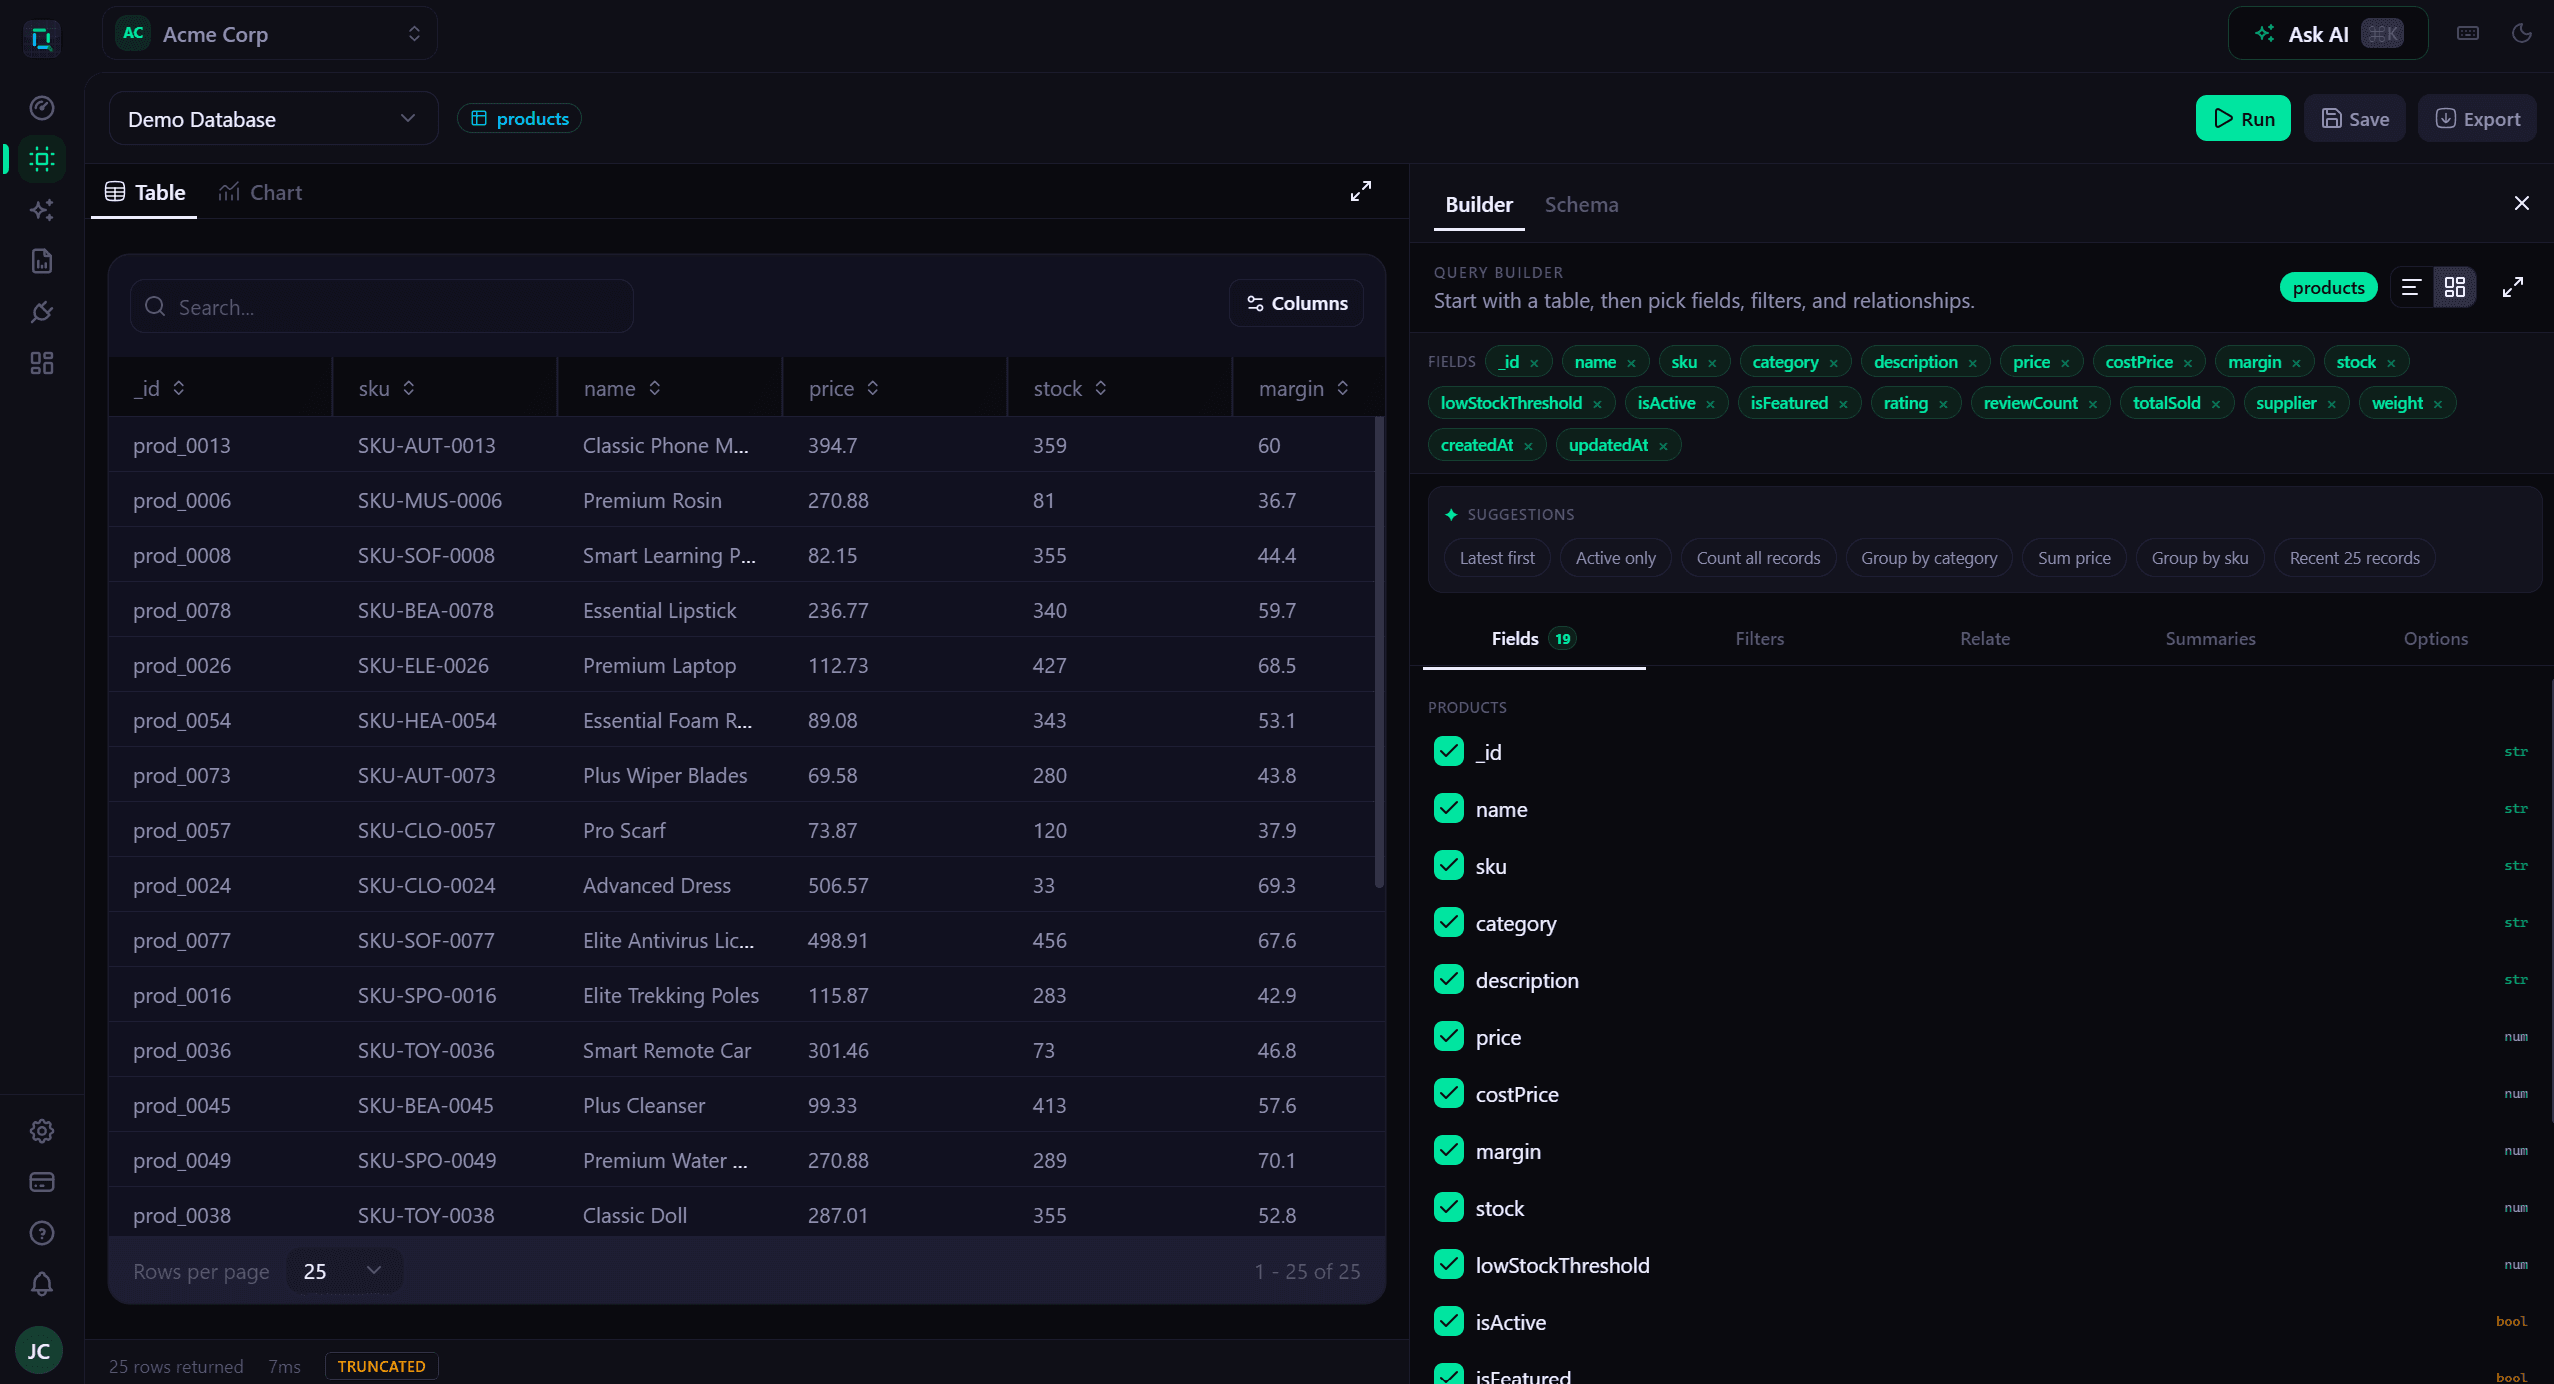
Step 02
Browse collections, tables, and fields so business questions map to real data structure more quickly.
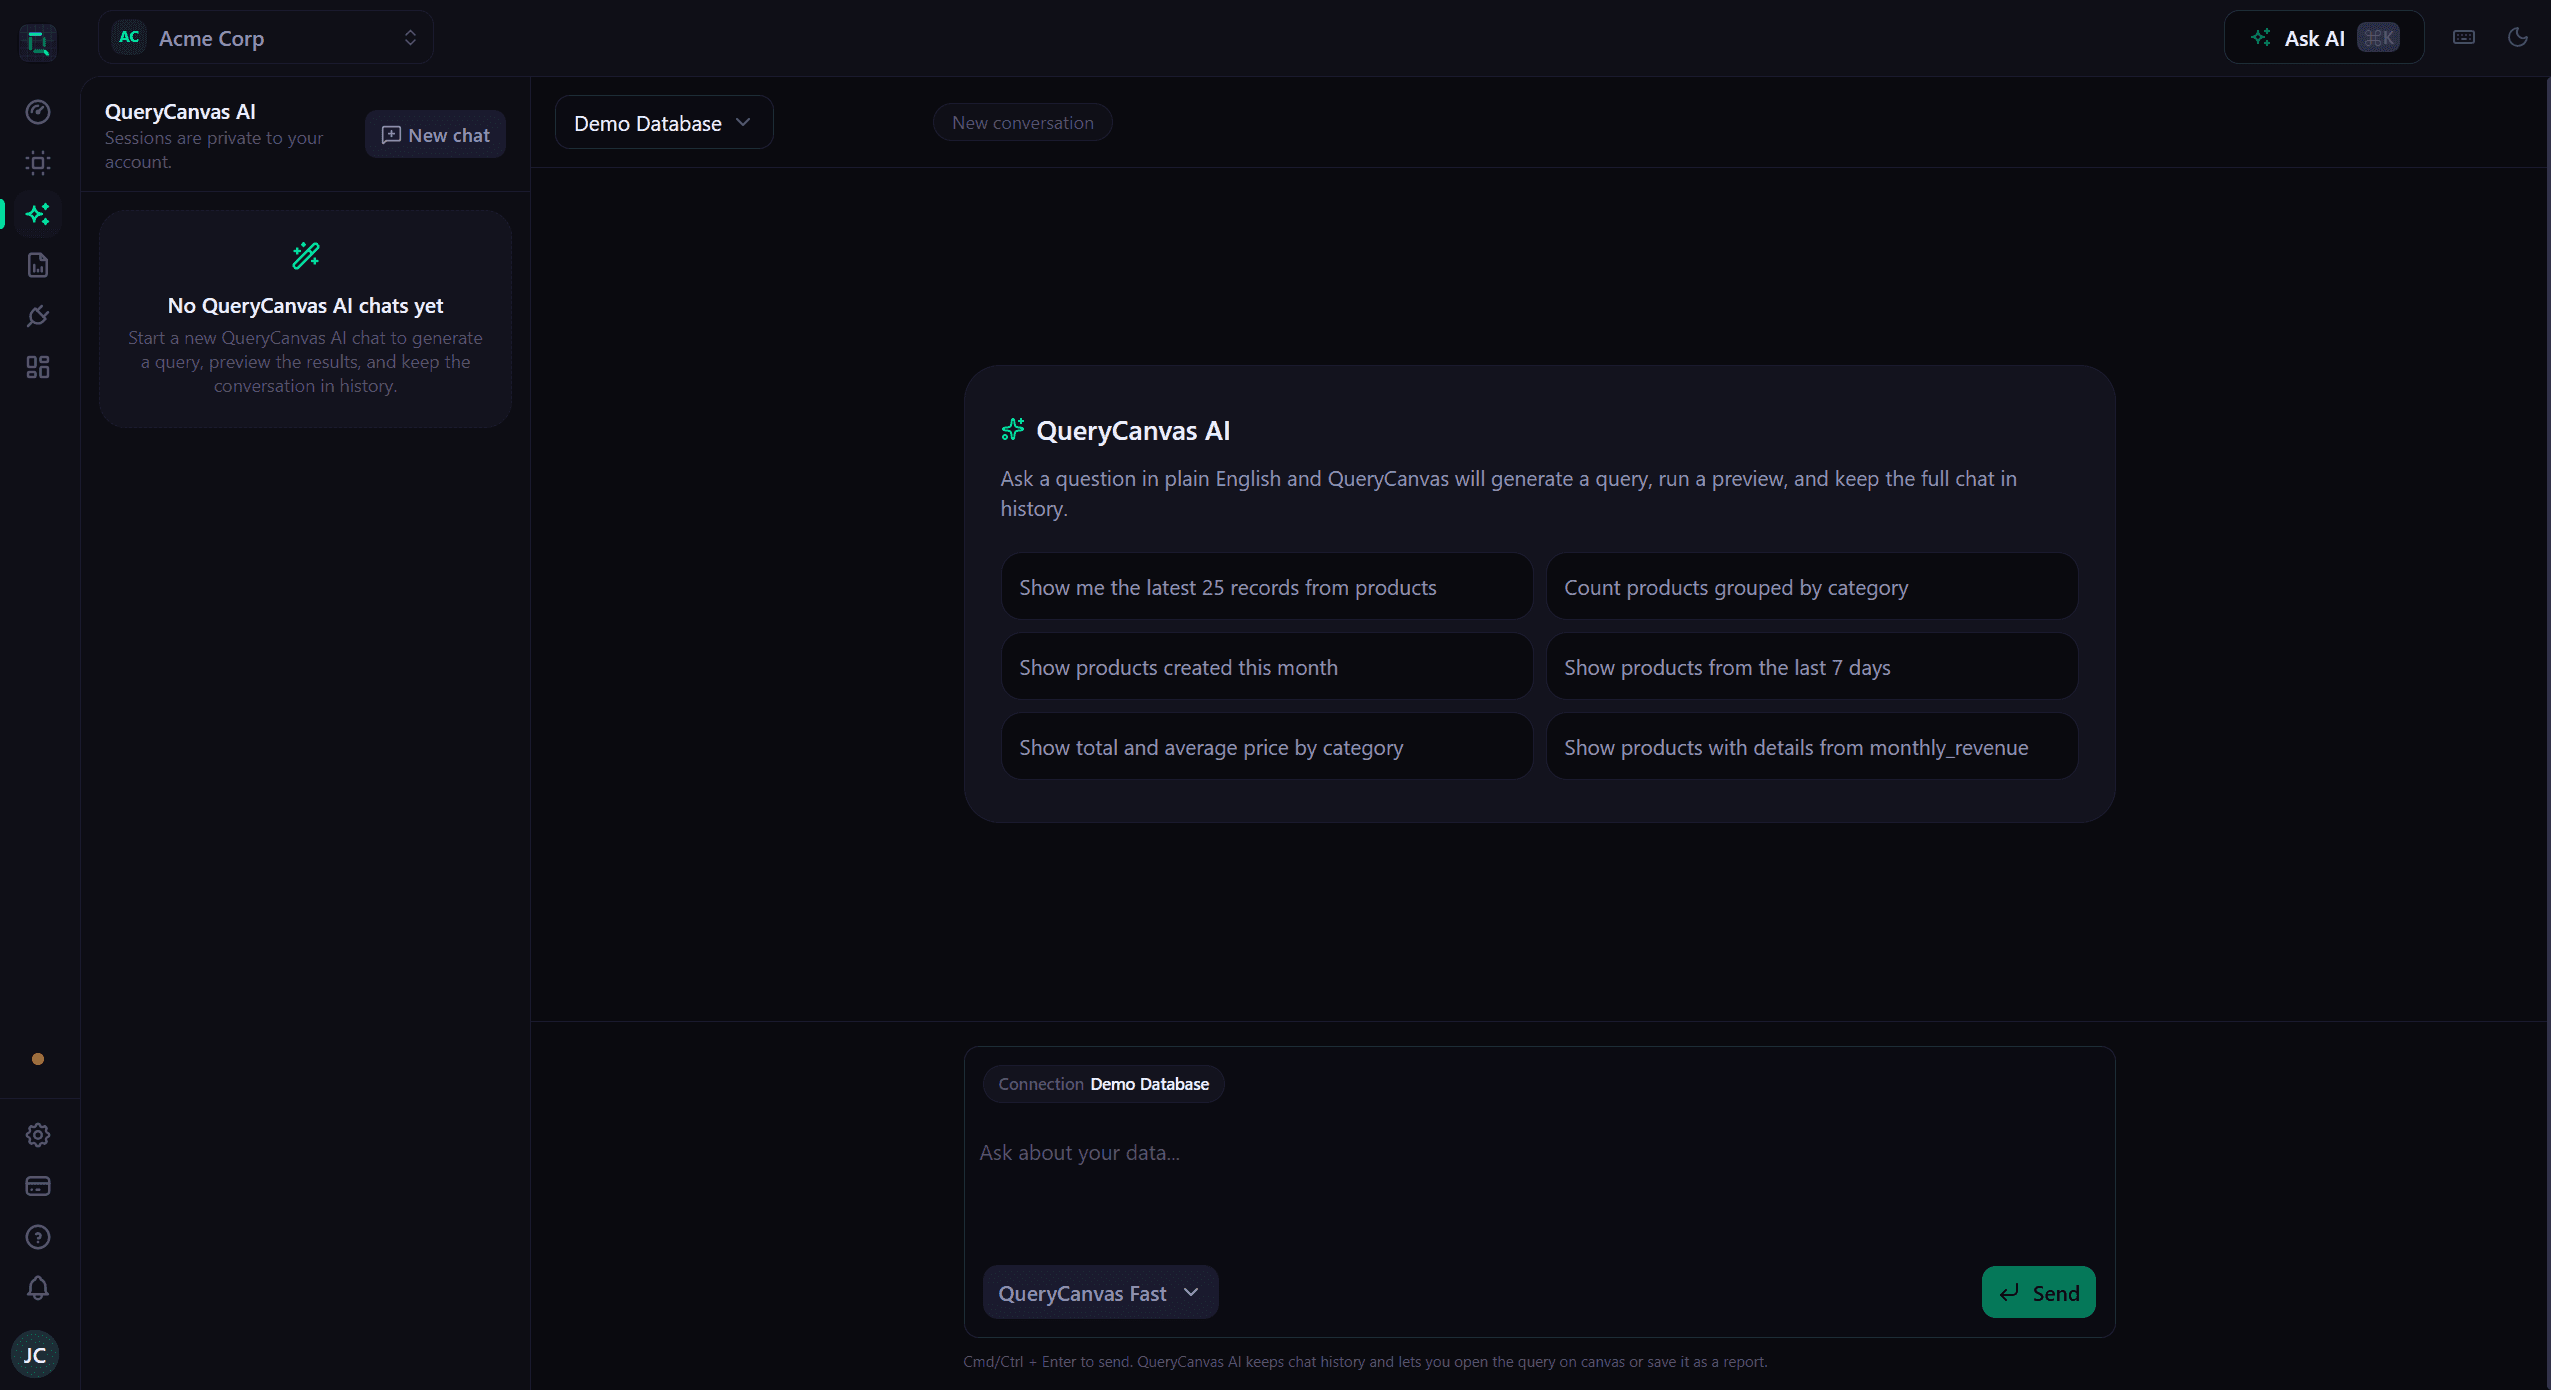
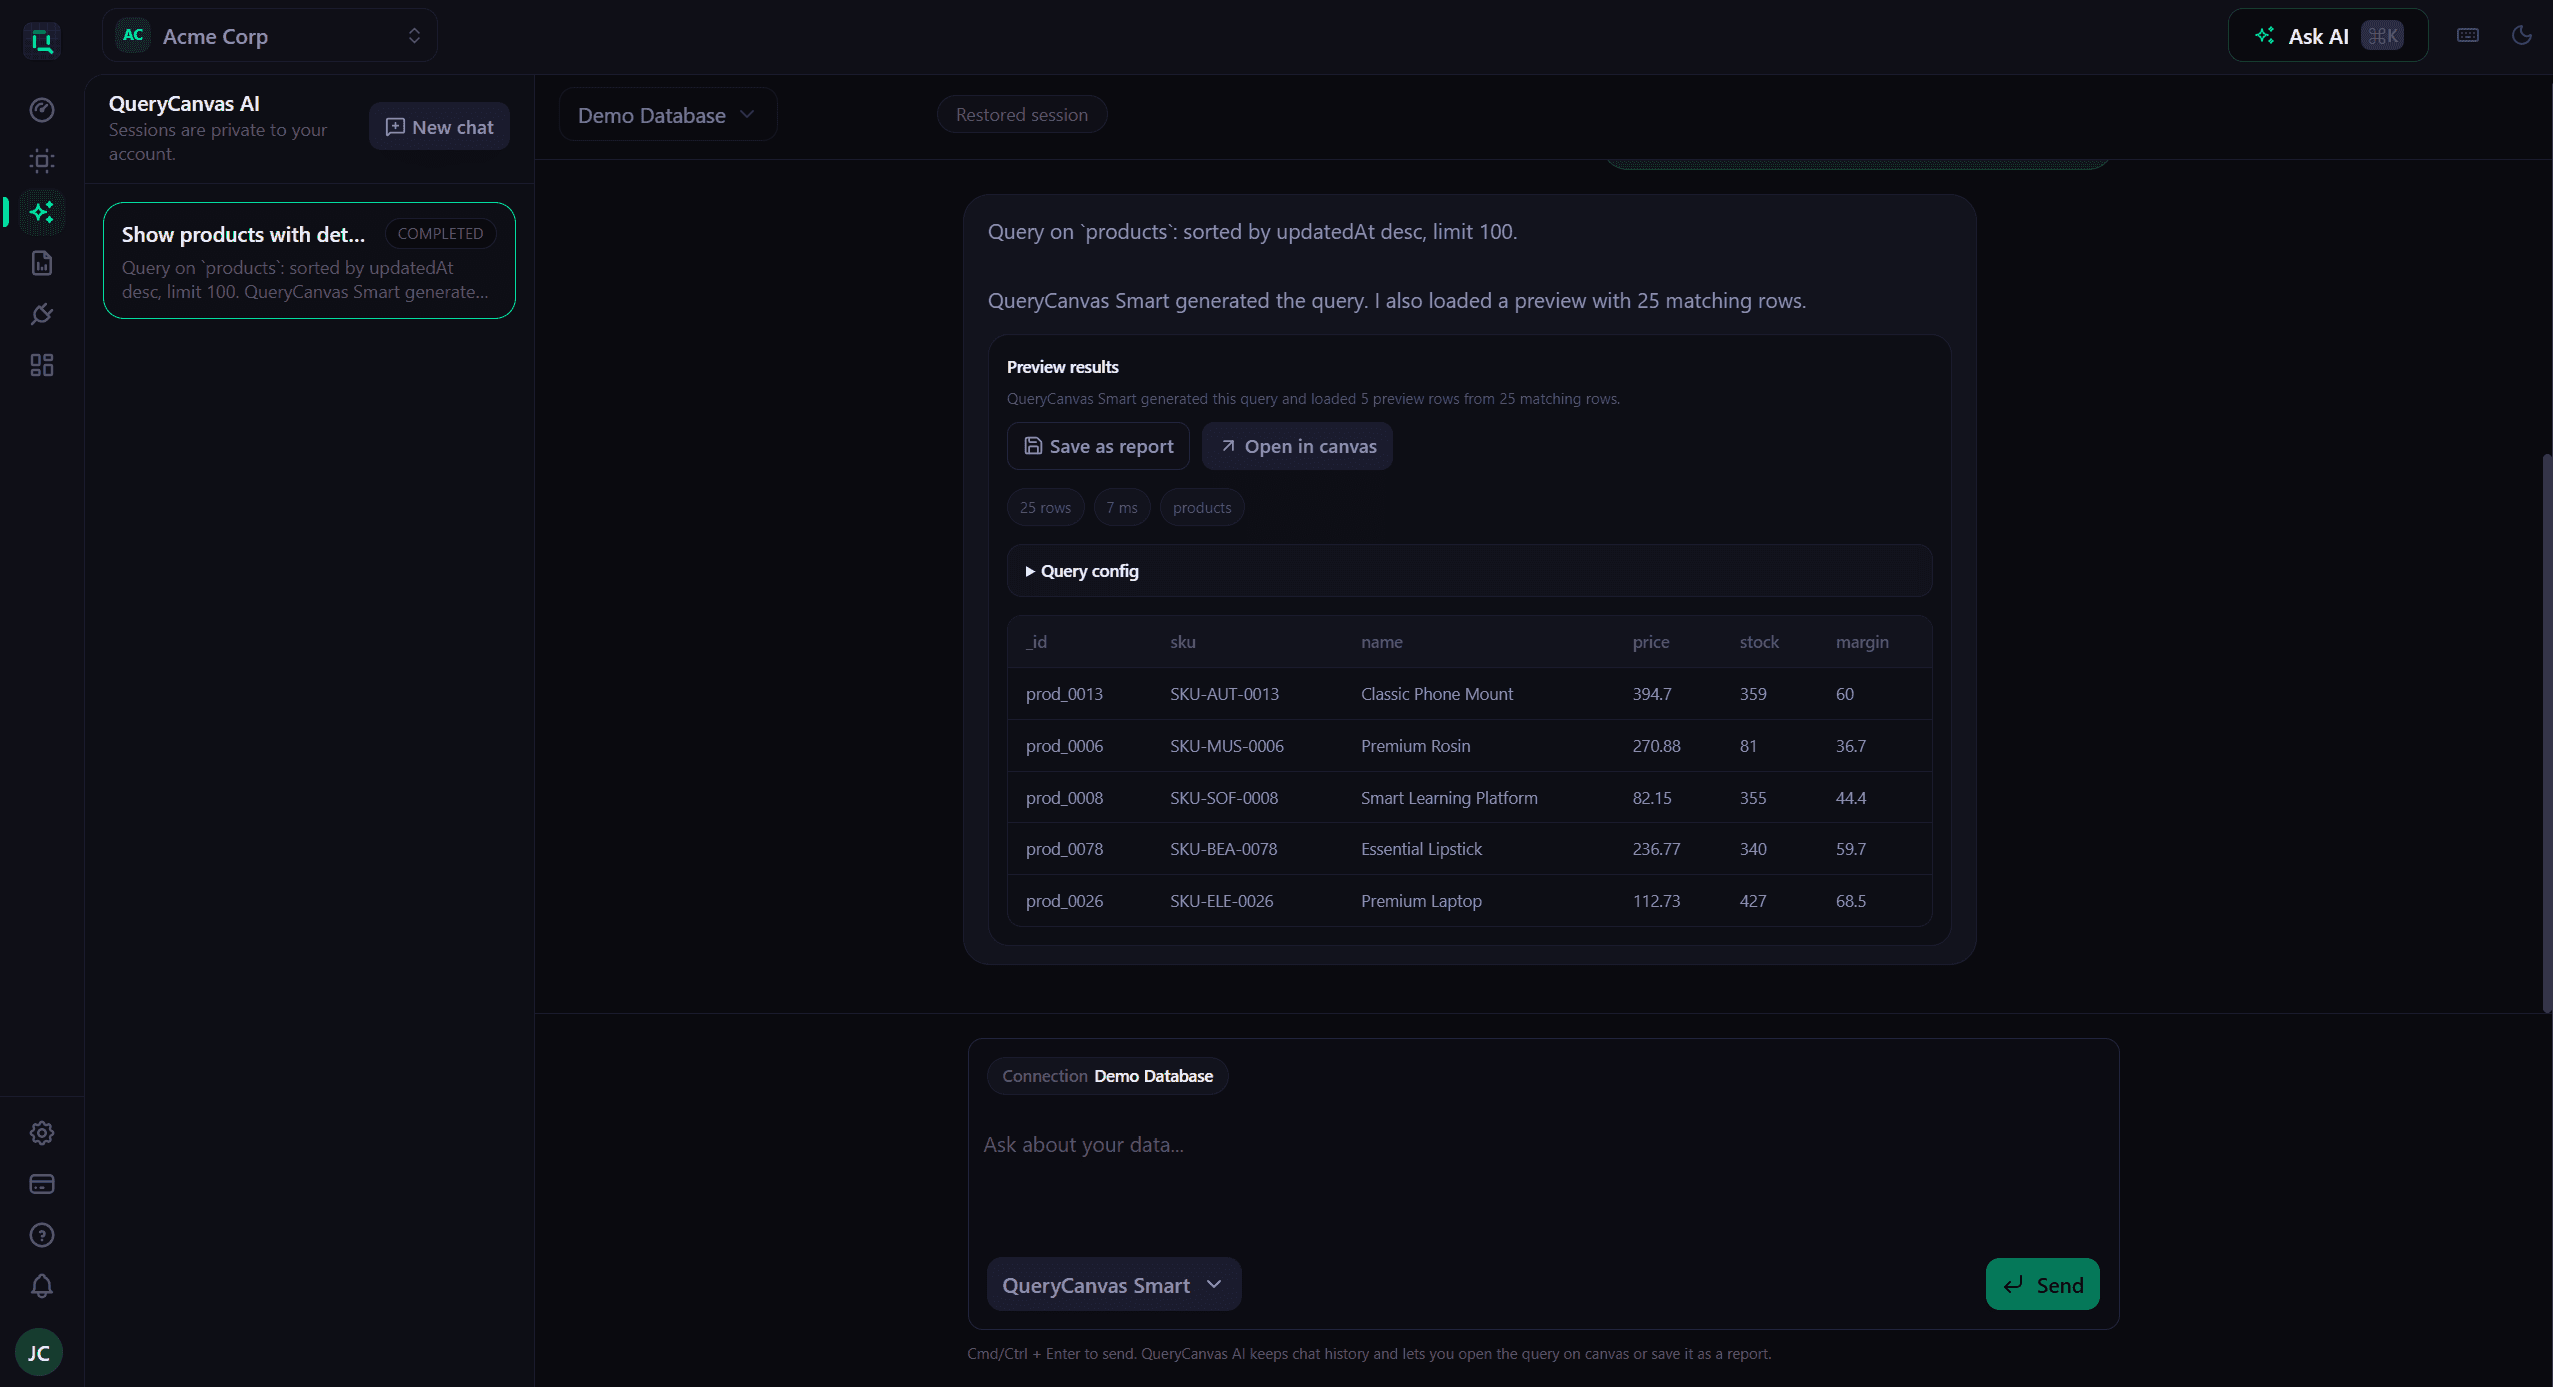
Step 03
Draft the answer in plain language, inspect the generated query, and refine it before sharing the result.
Step 04
Promote useful answers into widget dashboards, public shares, and reports with password or expiry controls when you need them.
Who it is for
QueryCanvas is especially valuable when technical users still need control, but the business needs a simpler way to ask and share data-backed questions.
Answer day-to-day business questions, track performance, and keep recurring reports moving without waiting on a custom SQL request.
Get faster visibility into connected data across finance, product, and customer operations without living inside raw tables.
Reduce repetitive request work, give teammates a safer self-serve path, and keep query context closer to the business question.
Package important metrics into dashboards, share them publicly when needed, and tighten access with passwords or expiry dates.
FAQ
The answers below are written to match what is visible on the site today, including data sources, AI-assisted querying, and the direct-query reporting model.
View the full FAQ pageFinal call to action
Start with the free plan, validate the workflow on a real source, and expand into dashboards and recurring reports when the team is ready.